Analytics Documentation
Analytics provide insight into how content is used and engaged with over time. By visualizing metrics such as page traffic, time spent, and interaction patterns, analytics help identify which concepts resonate with students, where confusion may arise, and how learning resources are being used over time. This page outlines the available analytics tools and how to interpret key patterns in the data. These insights allow for data-informed descisions and continuous improvement of content.
For additional information, please refer to the official Google Analytics Help guide to learn more. If a problem is still unsolvable after consulting the troubleshooting page, please submit an official issue on the github.
Home Page
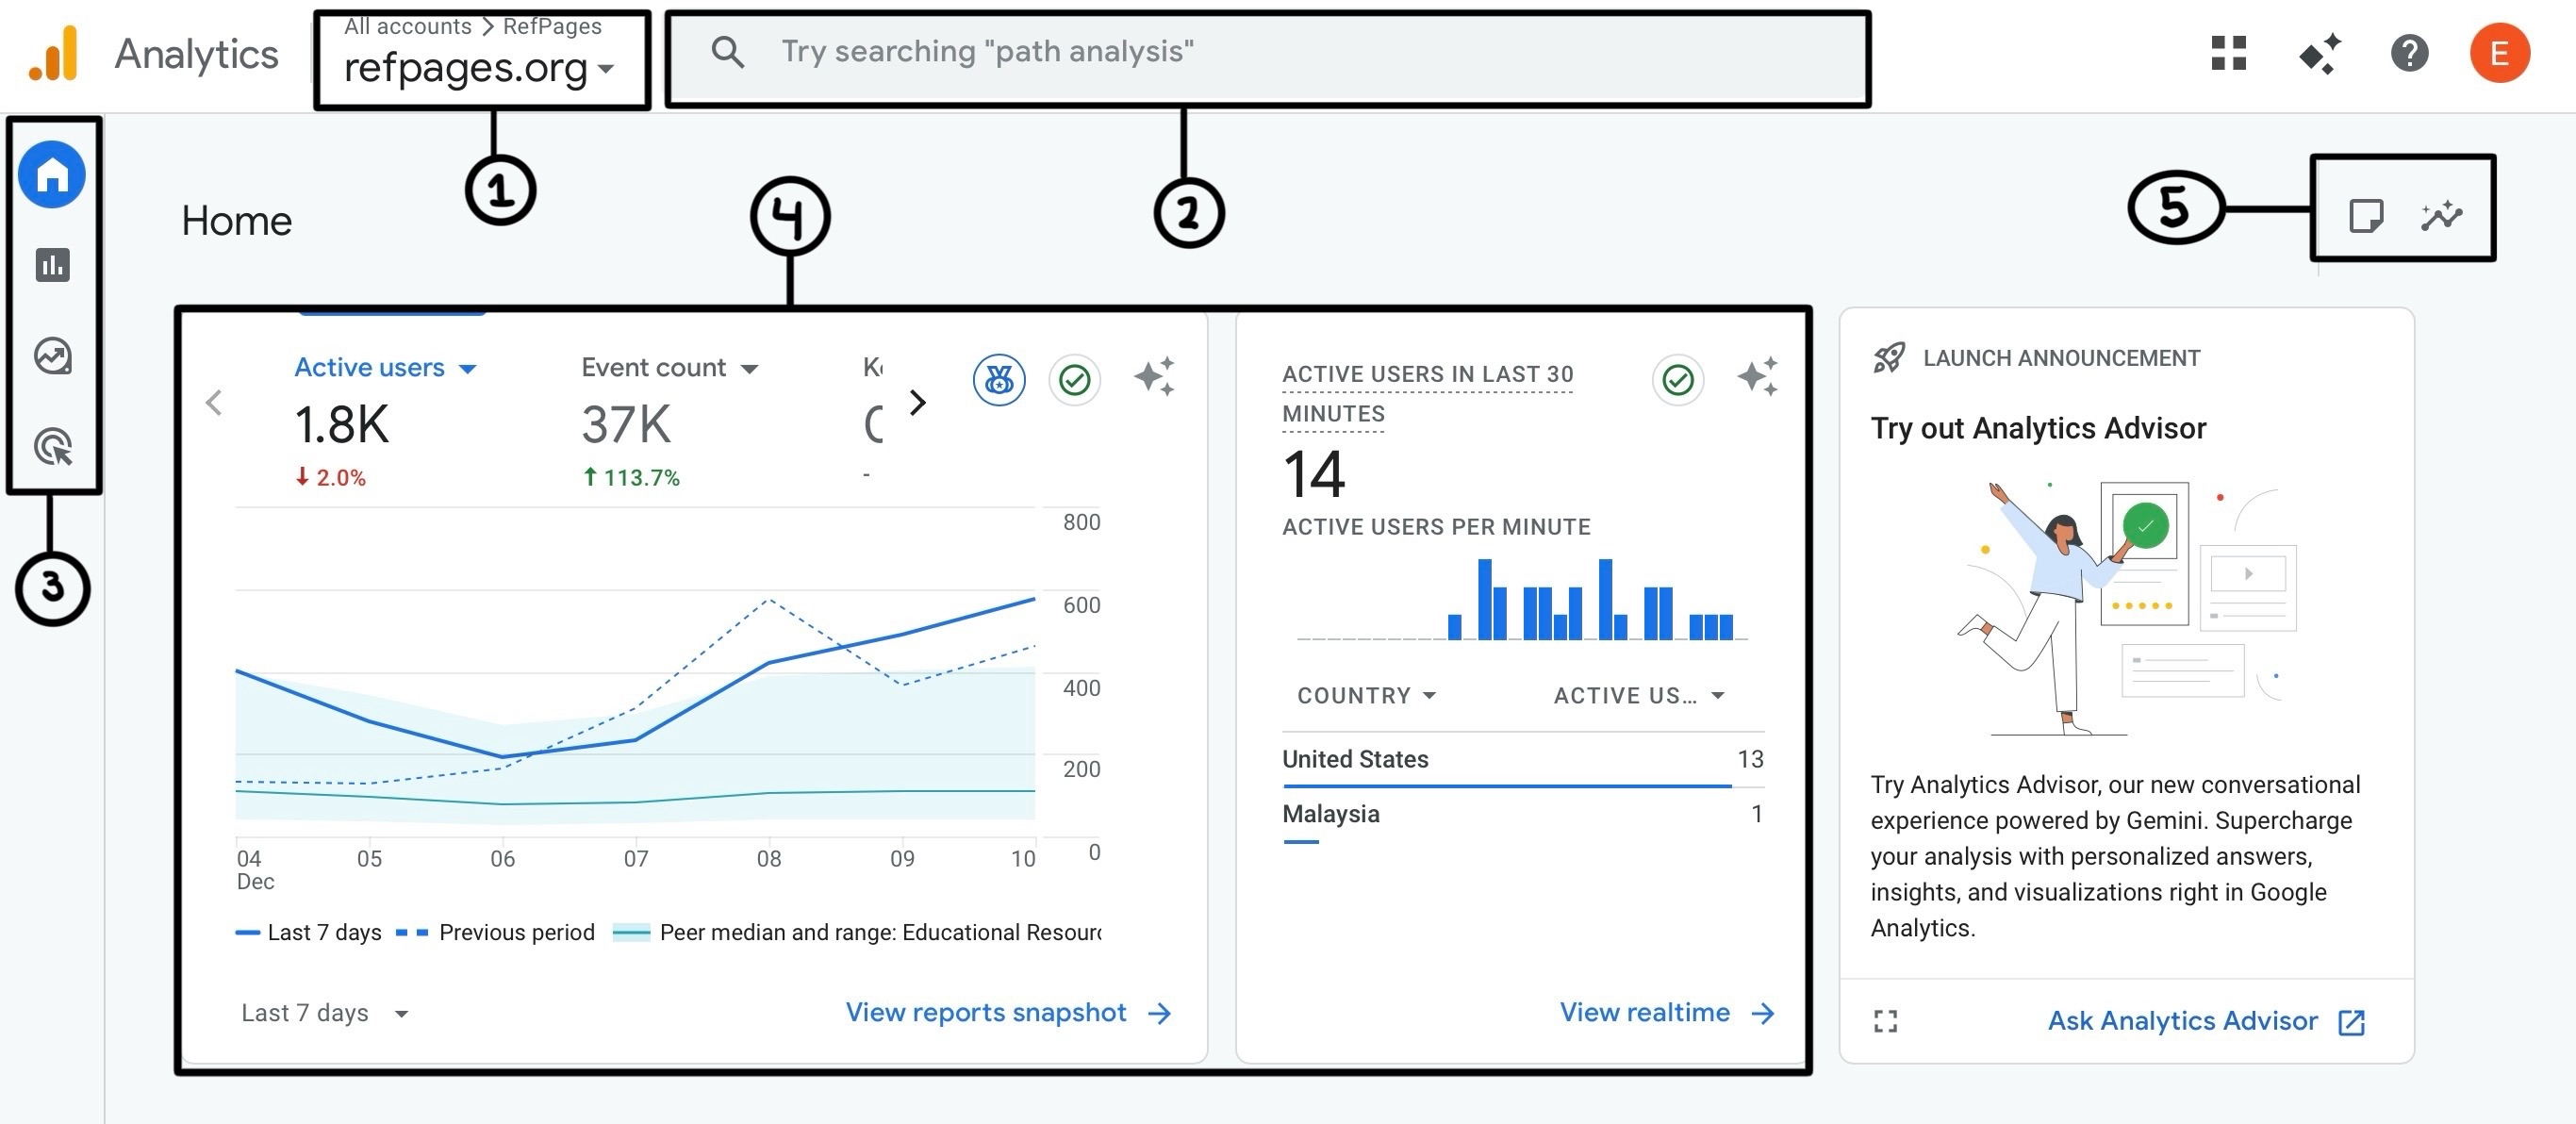 The analytics dashboard provides instructors with quick insights into how students interact with website overall.
- The menu in the top-left corner allows you to switch between all the accounts and properties for which you have permission to access.
- The search bar allows you to quickly find answers to your question, as well as locate reports, properties, and insights.
- The navigation panel provides links to
- Home: Provides a quick overview of key insights, trends, and real-time activity.
- Reports: Standard reports on traffic, engagement, and user behavior.
- Explore: Tools for building custom analyses and charts.
- Advertising: Insights on campaign results and attribution.
- The overview graph displays 7-day user, event, and view trends with comparison metrics, while the real-time graph shows active users from the last 30 minutes and their locations.
- These miscellaneous quick links let you navigate to the Analytics Advisor, an AI-powered helper.
Reports Page
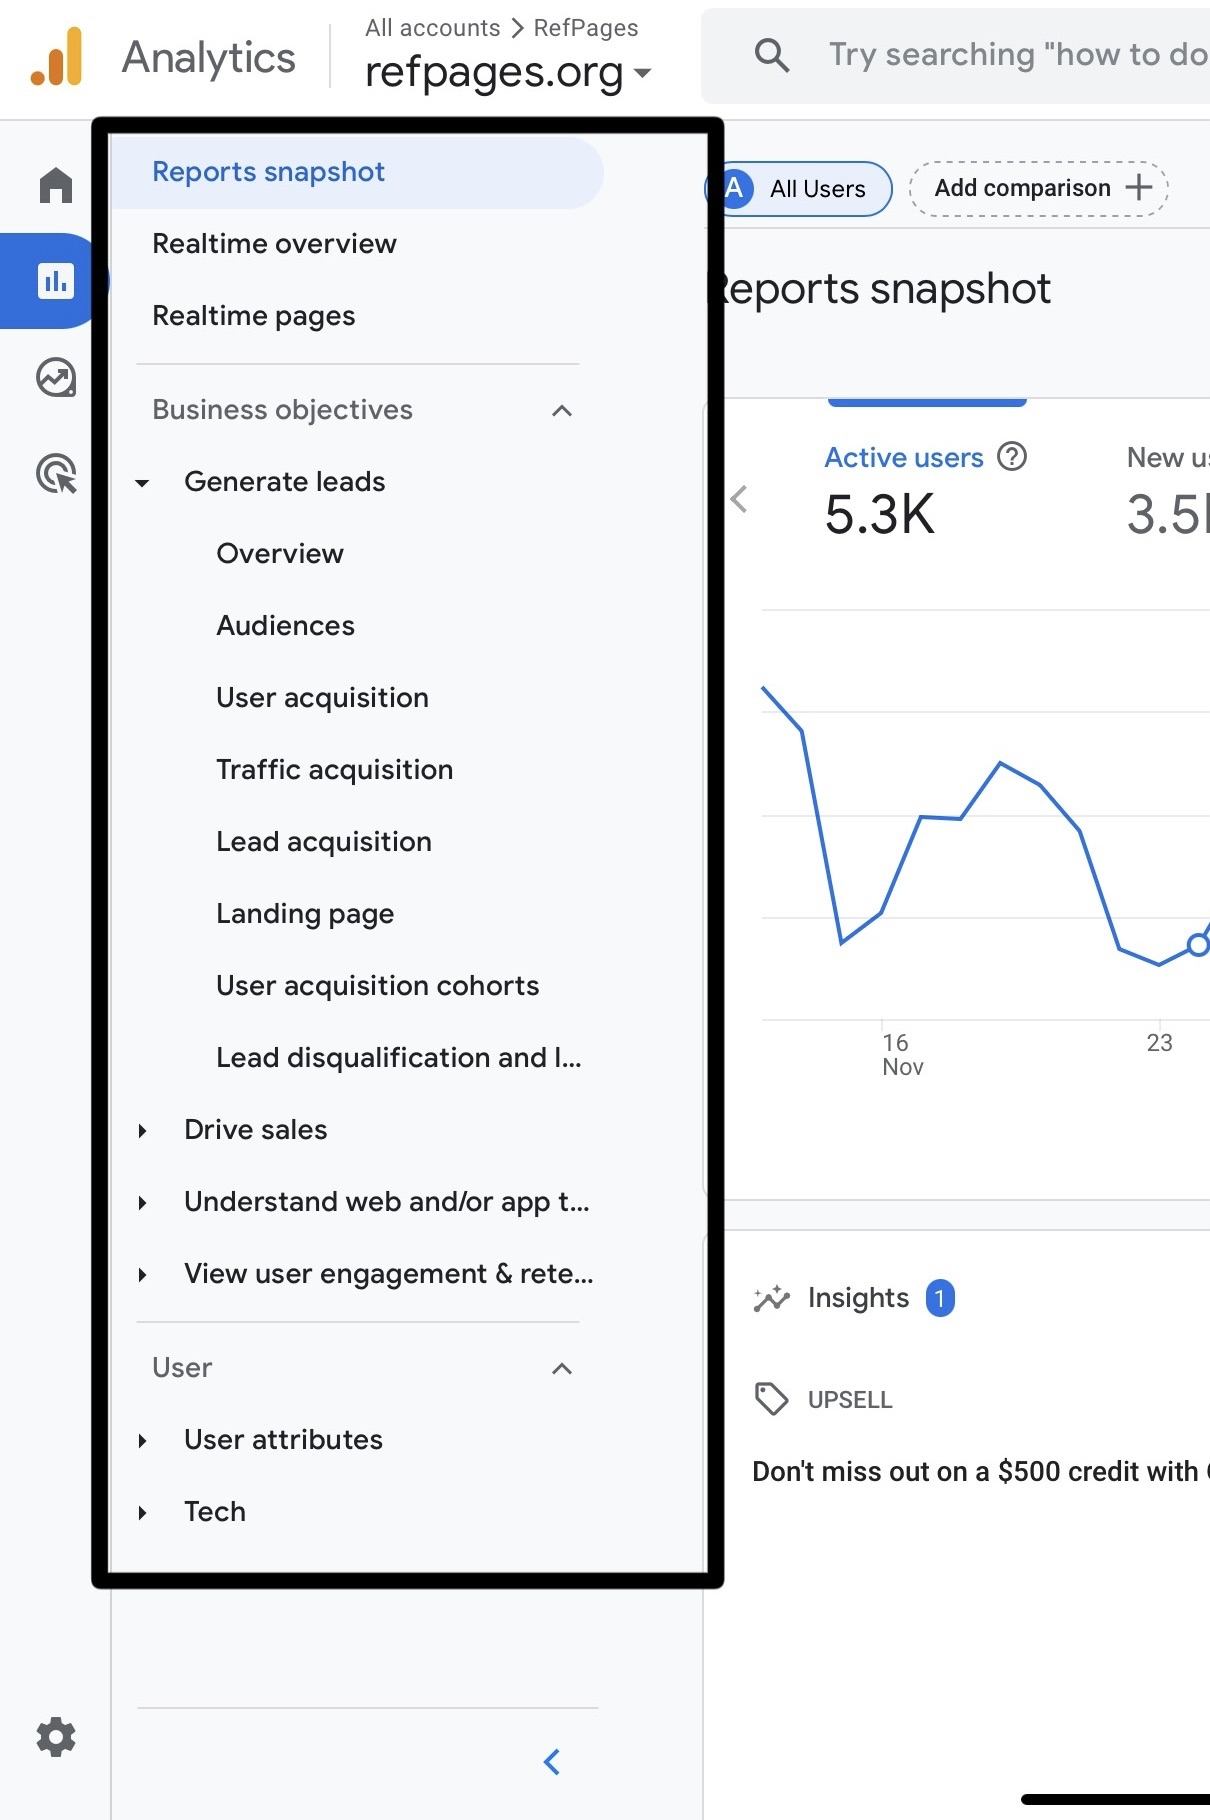
The left-side navigation menu organizes all Google Analytics reports by objective, helping you understand how users discover, navigate, and engage with your site.
Realtime Information — These reports show what is happening on your site currently.
- Realtime Overview and Snapshot: Displays active users on the site from around the world, event counts, and total views within the last few minutes.
- Realtime Pages: Shows which pages users are currently viewing, helping you monitor traffic spikes, live events, or sudden engagement changes.
Generate Leads — Reports that explain who your users are, how they arrive at your site, and what actions contribute to lead generation.
- Overview: High-level traffic and engagement summary.
- Audiences: Breaks users into segments based on shared attributes.
- User Acquisition: Shows how new users first found the site (search, social, direct).
- Traffic Acquisition: Detailed breakdown of traffic channels and mediums.
- Lead Acquisition: Tracks the pathways that produce leads or sign-ups.
- Landing Page: Performance of users’ entry pages.
- User Acquisition Cohorts: Groups new users by the first channel that brought them to your site and tracks how those users behave over time.
- Lead disqualification and loss: Shows where leads drop off or progress through the funnel.
Drive Sales — Focused on ecommerce and revenue-related behavior. This includes insights into conversions, purchase trends, and overall monetization performance.
Understand Web and/or App Performance — Shows technical metrics such as page load times, responsiveness, and other performance signals that affect user experience.
User Engagement & Retention — Highlights how long users stay on the site, which pages they return to, and overall engagement patterns that indicate site effectiveness.
User Attributes — Provides demographic information, device types, browser technology, and other background details to help you understand who is visiting and how they access your site.
Explore Page
The Explore page gives you full control to create custom analyses that goes beyond the sites standard reports. Unlike the report dashport, Explore lets you build your own visualizations, filter data, compare across different metrics, and dig deeper into user behavior.
Free-form Exploration: A flexible table + chart builder that lets you drag and drop dimensions, compare user segments, add filters, and visualize trends in any format (bars, lines, tables, heatmaps). Best for investigating patterns, segment differences, and multi-metric comparisons.
Cohort Exploration: Groups users based on shared characteristics (like first-visit date) and tracks how their behavior changes over time. Useful for analyzing retention, comparing exam-week vs. non-exam-week users, or identifying when engagement drops.
Funnel Exploration: Builds multi-step funnels to reveal where users drop off. Supports both open funnels (users can enter at later steps) and closed funnels (must follow exact step order). Best for tracing flows from homepage → course pages → practice problems → animations.
Segment Overlap: A Venn diagram-style visualization that compares multiple user groups. Helps you see relationships between segments, like exam-week visitors who also explore animations and complete practice quizzes.
Path Exploration: Visualizes how users navigate from one event or page to the next. You can choose a starting point (forward path) or an ending point (reverse path). Great for seeing where students go after landing on a homework page or which paths lead to high bounce rates.
User Explorer: Provides anonymized individual user journeys, showing event sequences, pages viewed, engagement time, and session counts. Useful for debugging unusual behavior (such as repeated page reloads).
User Lifetime: Tracks long-term engagement and value contributions of user cohorts. While often used for businesses, it can show whether early-semester users continue returning throughout the term.
Free form
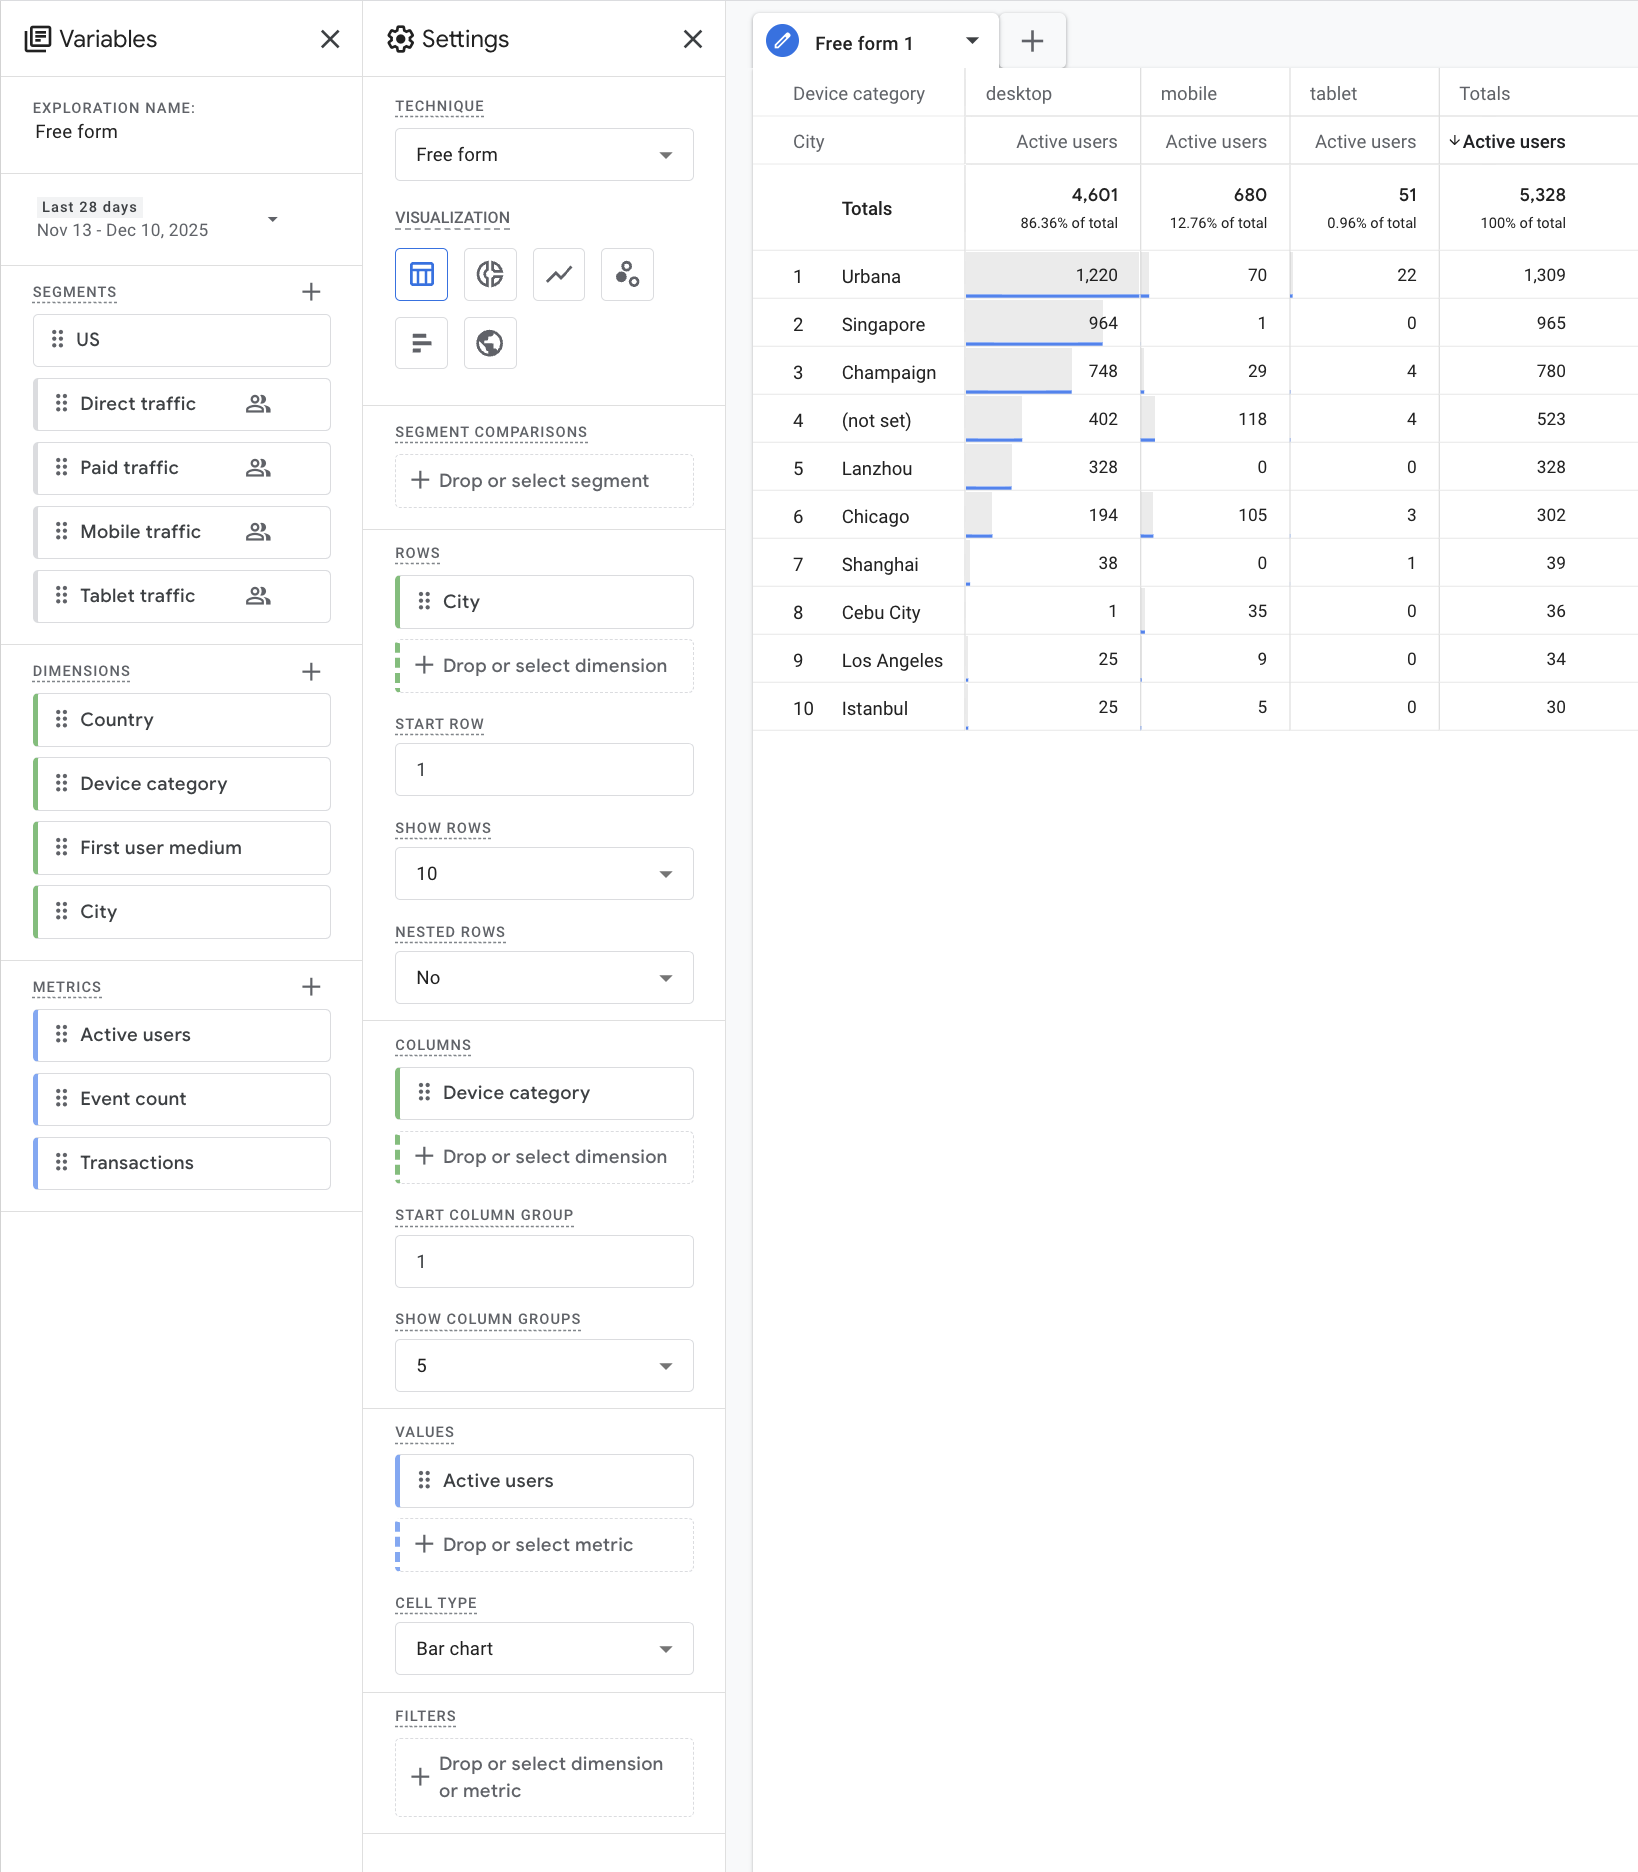
The Free Form technique is different from other Google Analytics explorations because it has no predefined question it is trying to answer. Instead of guiding you through a specific analysis (like funnels or paths), it gives you a blank canvas where you decide what dimensions, metrics, and comparisons to use, allowing you to explore data freely and uncover patterns that aren’t visible in standard reports.
When starting any exploration in Google Analytics, begin by choosing the technique you want to use. Each technique offers a different style of analysis, so selecting it first sets the structure for everything that follows. Once the technique is chosen, pick a visualization style that best represents the kind of insight you're looking. After the layout is set, use the Variables panel to choose the data you want to include. This is where you add dimensions like device category or city, and metrics such as active users or event count. From there, drag these variables into the Settings panel to shape the rows, columns, values, and filters. Following this workflow ensures you build a clear, accurate, and meaningful exploration regardless of the technique you choose.
Variables panel
- Exploration name: The title of your exploration, used to identify and organize different analyses.
- Segments: User groups available for comparison. Includes: US, Direct traffic, Paid traffic, Mobile traffic, Tablet traffic.
- Dimensions: Categories used to break down data. Includes: Country, Device category, First user medium, City.
- Metrics: Numerical values measured in your report. Includes: Active users, Event count, Transactions.
Settings panel
- Technique: Determines the type of exploration. Example shown: Free form, path exploration, funnel exploration, and more.
- Visualization: Controls how your data appears. Options shown include table, donut chart, line chart, scatterplot, bar chart, and geo map.
- Segment comparisons: A place to drag segments to compare different user groups in the same visualization.
- Rows: Defines how data is organized vertically.
- Start row: Sets which row the table begins displaying.
- Show rows: Determines how many rows are visible.
- Nested rows: Enables or disables hierarchical row structure.
- Columns: Defines how data is organized horizontally.
- Start column group: Sets which column group appears first.
- Show column groups: Number of column groups displayed.
- Values: Metrics added here populate the table or chart.
- Cell type: Controls how each cell visualizes data.
- Filters: Drop a dimension or metric here to restrict what data appears in the visualization.
Funnel exploration
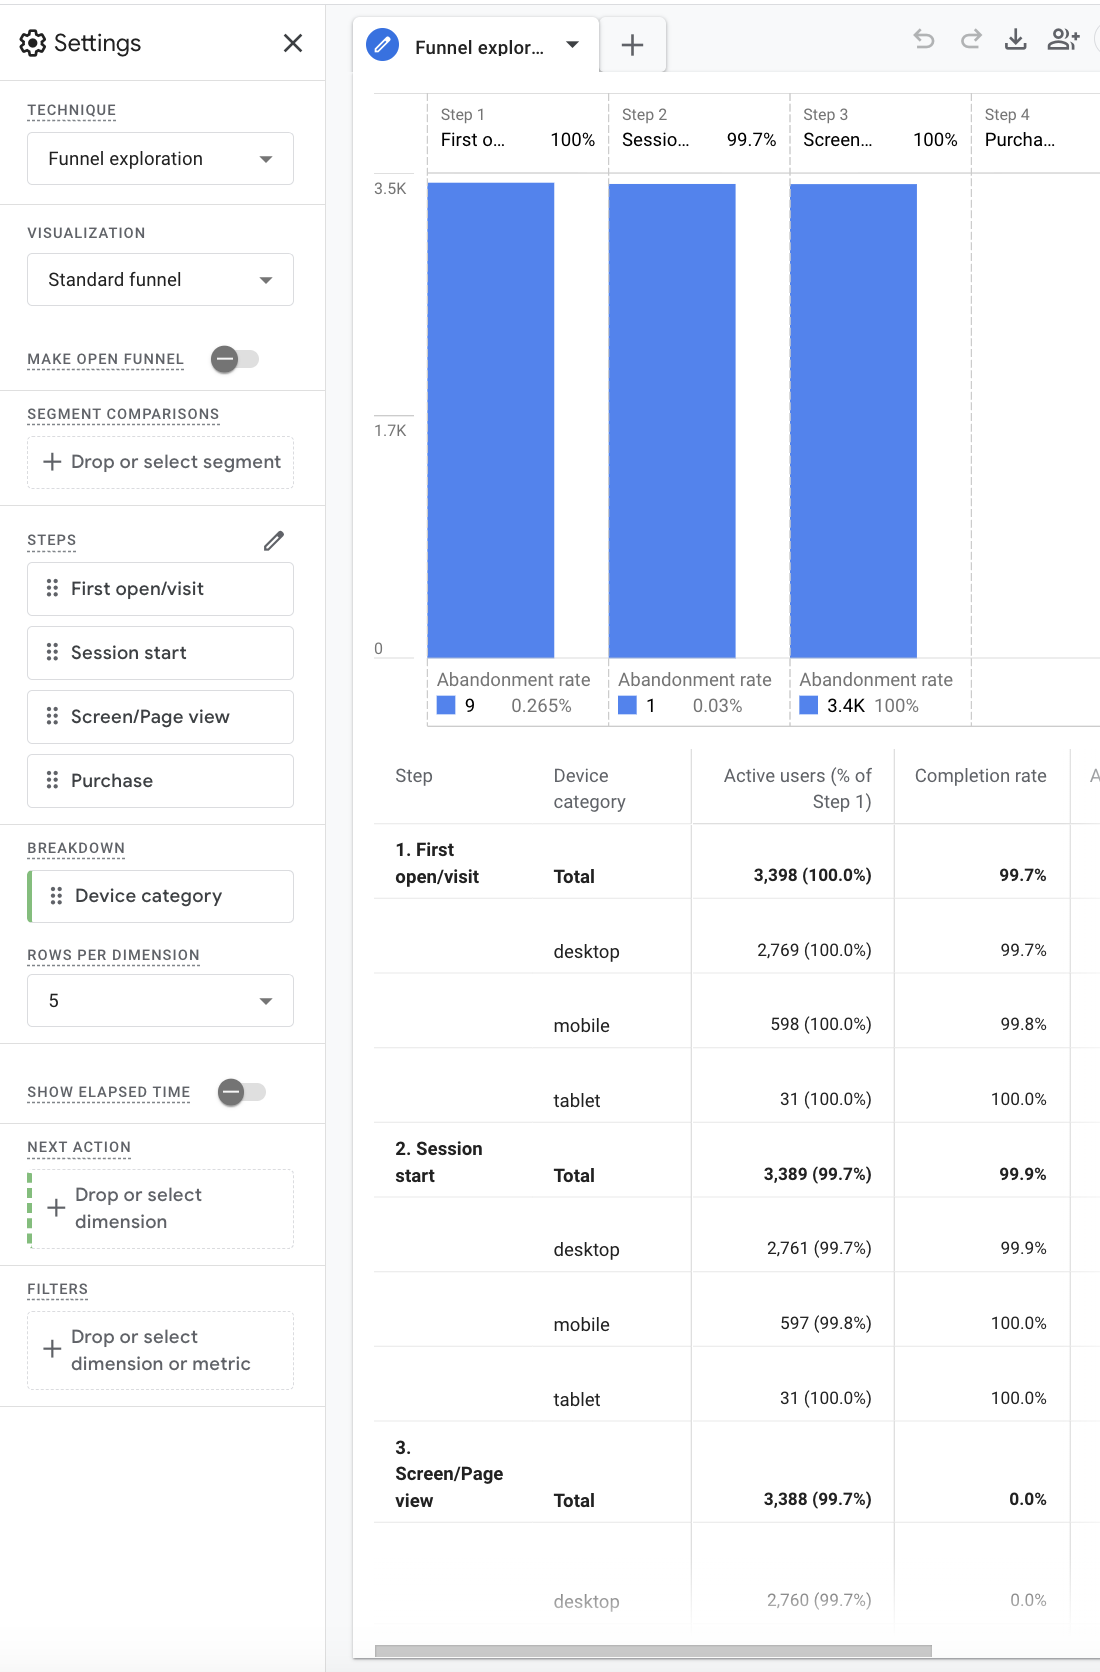
In the funnel exploration, each vertical bar represents a defined step in a user journey through the page, with height indicating how many users reached that stage. The percentages shown above each step reflect step-to-step completion, while the abandonment rates displayed below highlight where users exit the flow. The table beneath the chart mirrors this progression numerically, allowing you to compare total users and completion rates across different device categories in the same view.
Settings panel
- Make Open Funnel: Determines whether users must start at the first step or can enter the funnel at any step.
- Steps: Defines each stage of the funnel. Each step corresponds to an event or page view in the user journey.
- Breakdown: Splits funnel results by a selected dimension, such as device category.
- Rows per Dimension: Controls how many rows are displayed for each breakdown in the results table.
- Show Elapsed Time: Displays how long users take to move between steps in the funnel.
- Next Action: Specifies the dimension used to determine what users do after completing a step.
- Filters: Limits the funnel to specific users, events, or conditions.
Path exploration
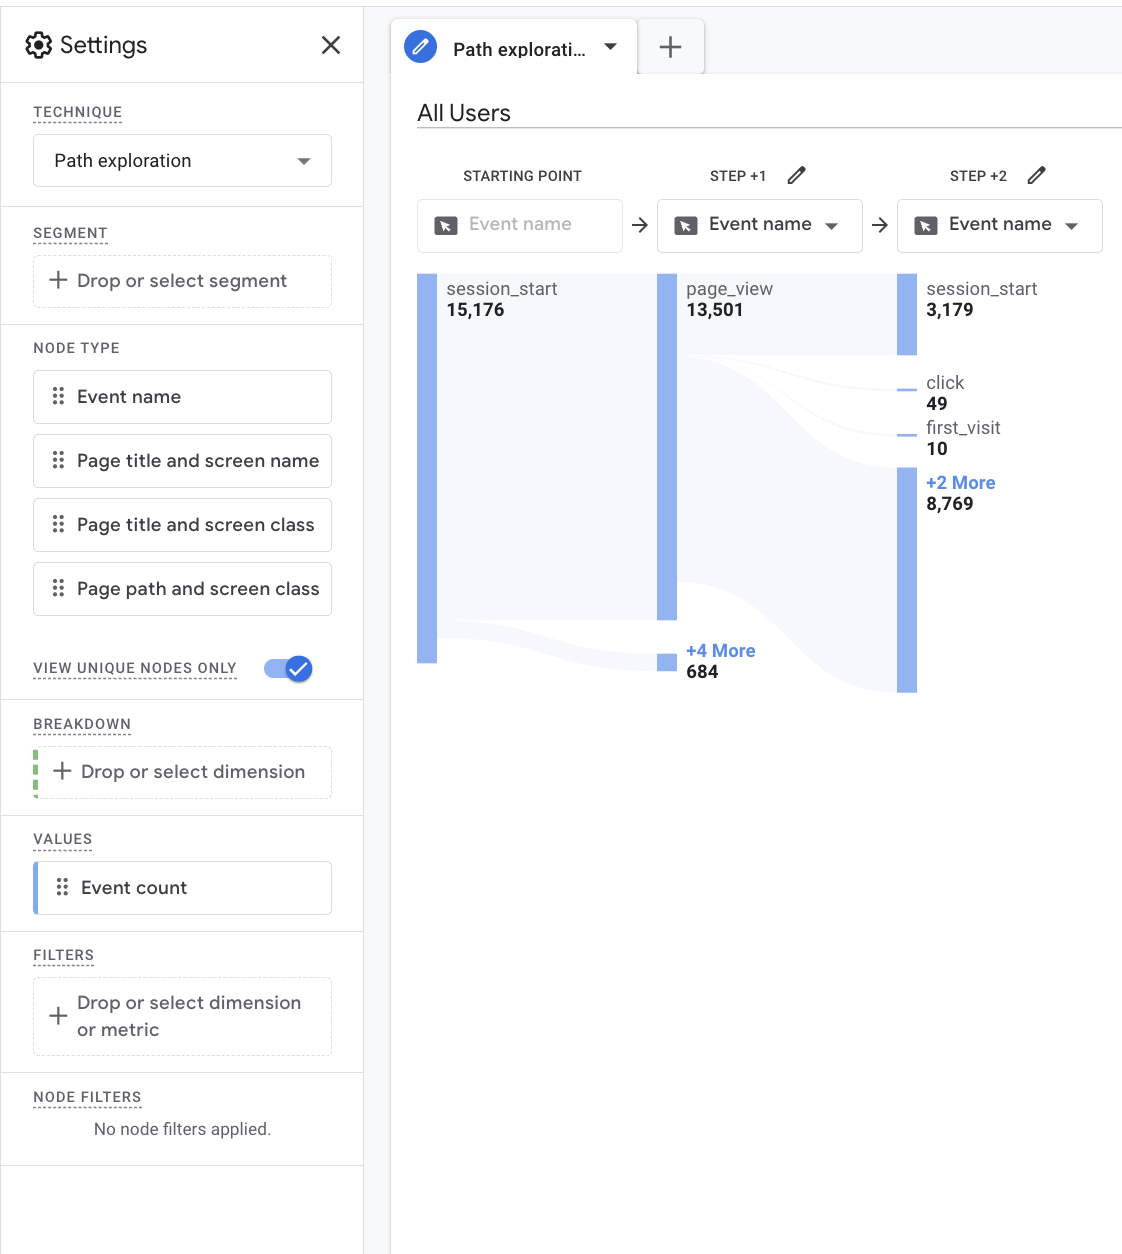
The path exploration visualizes user movement as a flow diagram, where each column represents a sequence of actions and the width of each connection reflects event frequency. Nodes expand dynamically to reveal additional paths, making it easy to identify navigation routes as well as less common interactions. This view emphasizes how users branch, loop, or drop off as they move between events and pages.
Settings panel
- Node Type: Determines what each node represents, such as event name, page title, or page path.
- View Unique Nodes Only: Toggles whether repeated nodes are combined or shown separately.
- Breakdown: Adds an additional dimension to split paths and compare navigation behavior.
- Values: Controls which metric is used to size nodes, such as event count.
- Node Filters: Allows specific nodes or paths to be included or excluded from the visualization.
Metrics
Engagement
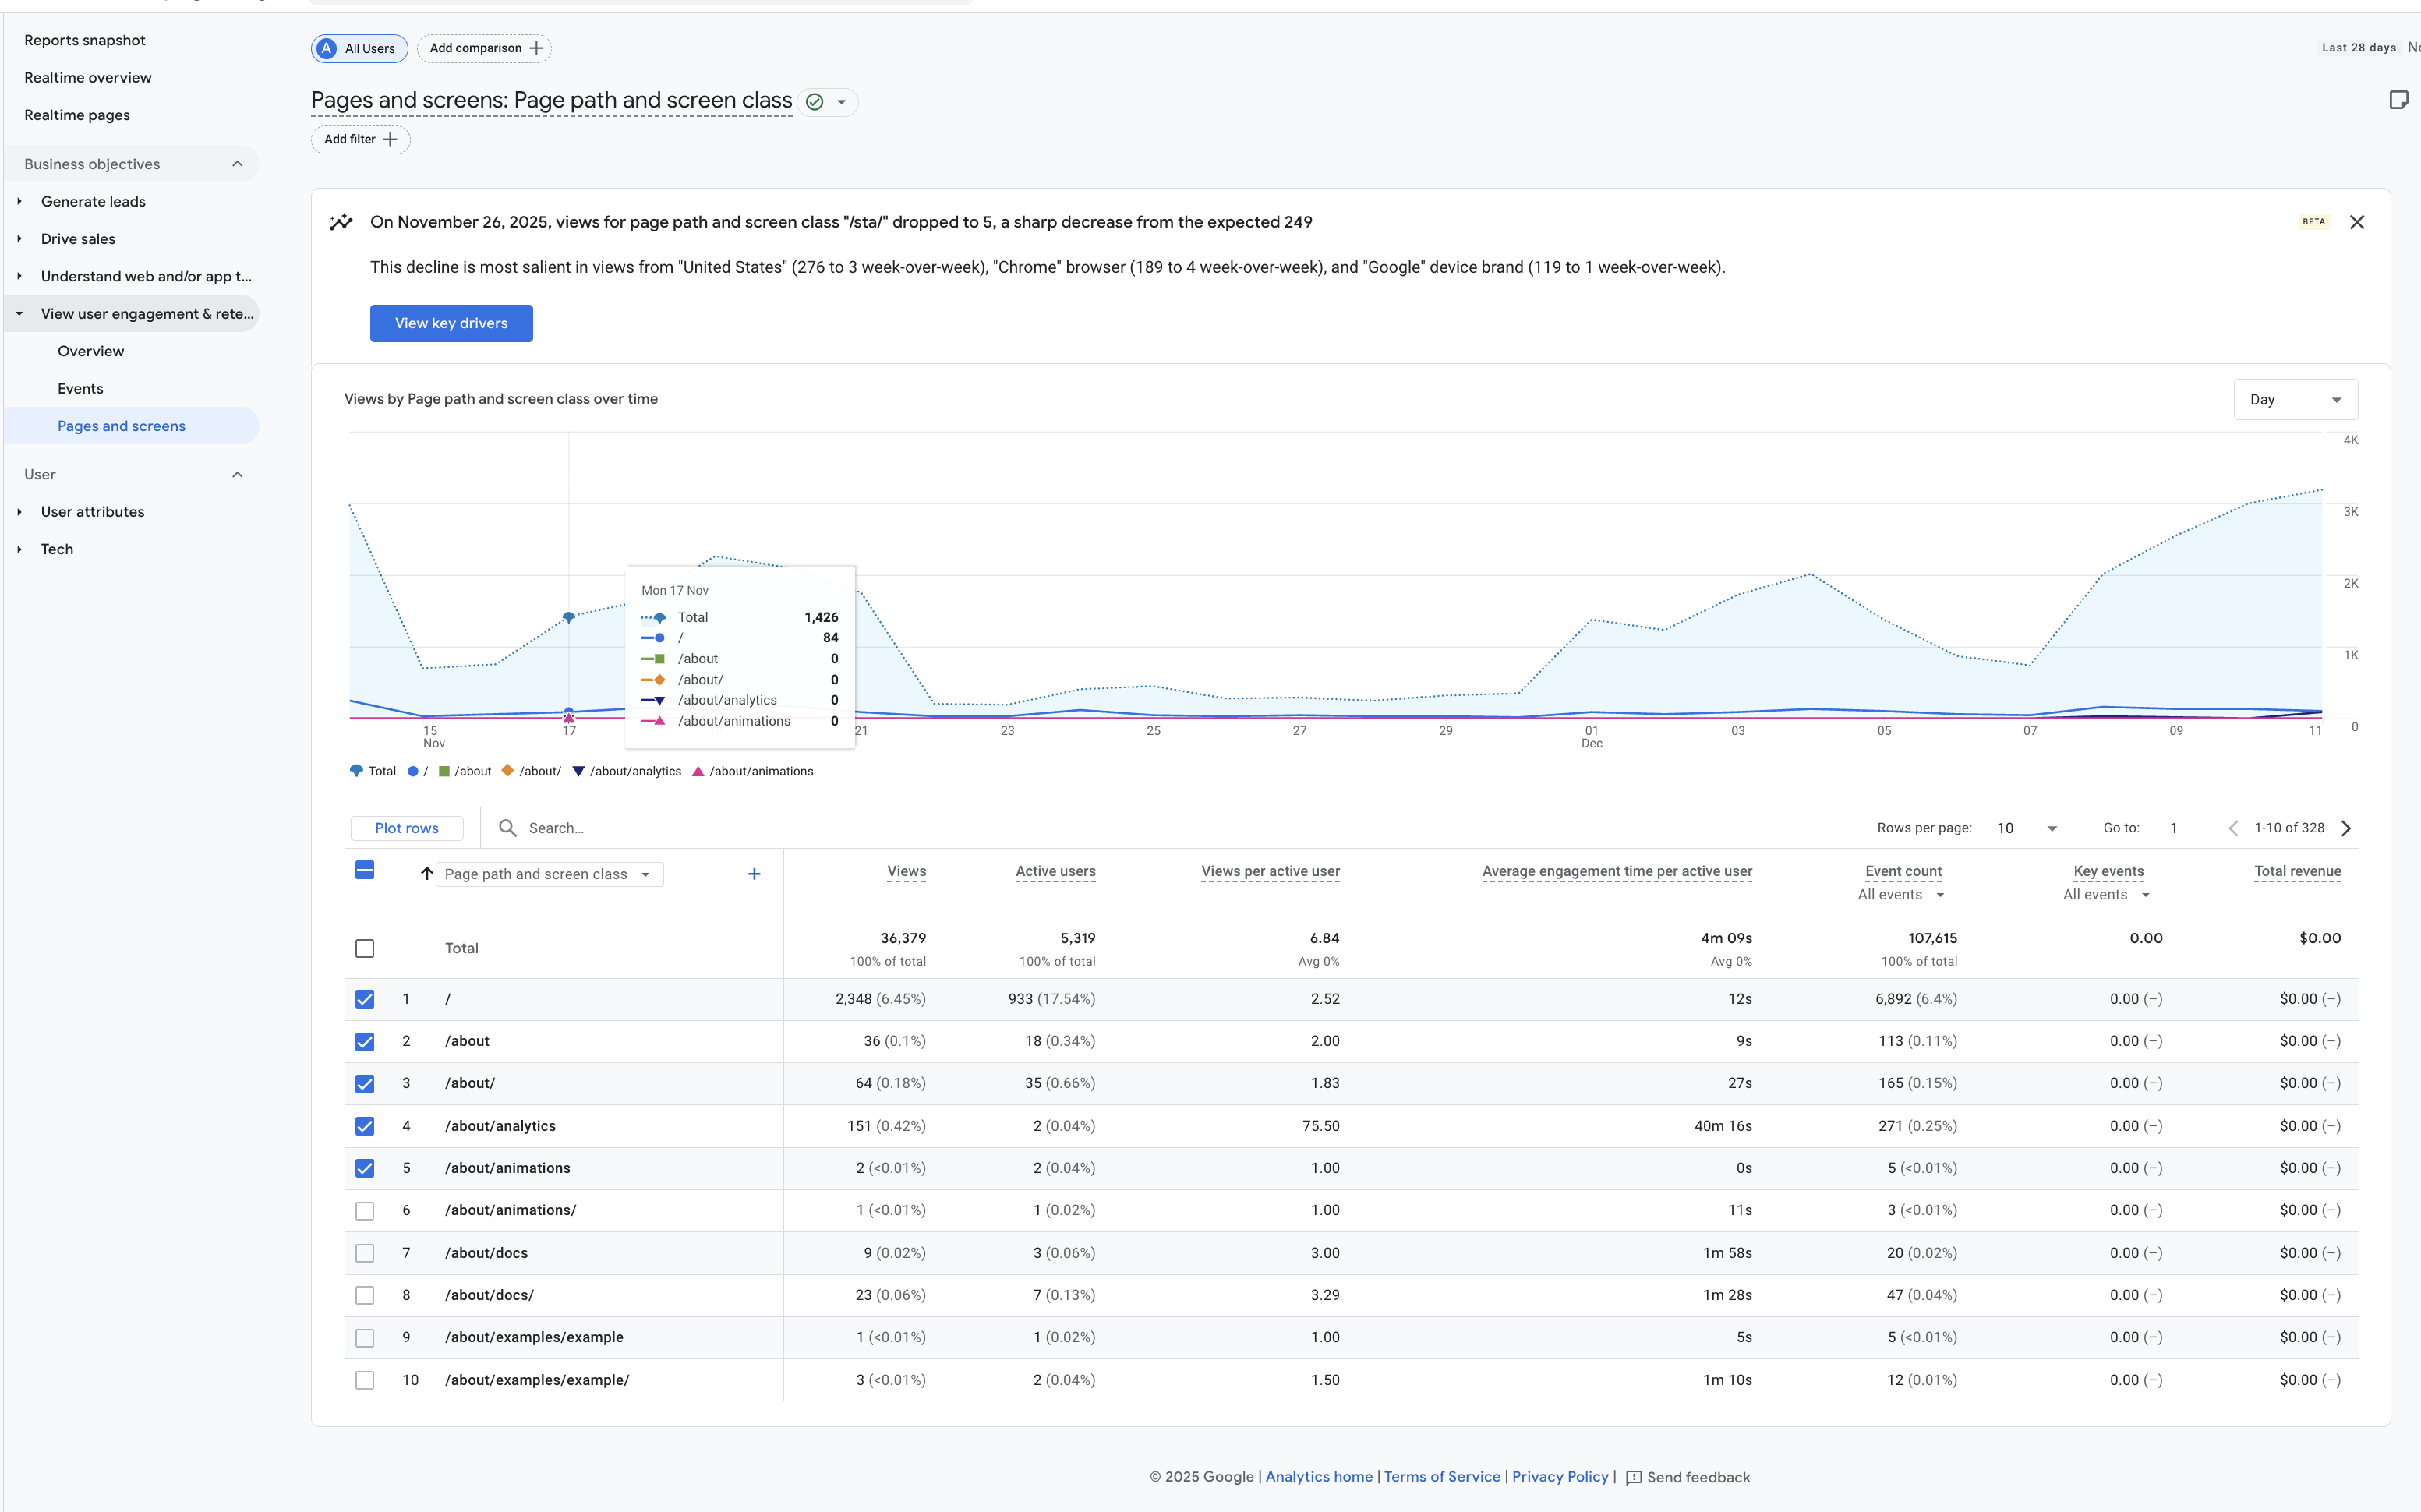
Filter analytics data by course to isolate how students interact with specific content rather than viewing site-wide averages.
For detailed engagement analysis, navigate to Reports → View user engagement & retention → Pages and screens. From there, identify sessions that align with exams, quizzes, or homework deadlines and examine page-level metrics such as views, average engagement time, and event counts.
Use the Event count column in the Pages and screens table to analyze specific user interactions. Clicking an event name allows you to break down which actions occurred on a page, such as link clicks, button presses, or interactive components. This helps distinguish passive page views from active engagement and provides insight into how students are actually using the content.
Traffic Sources
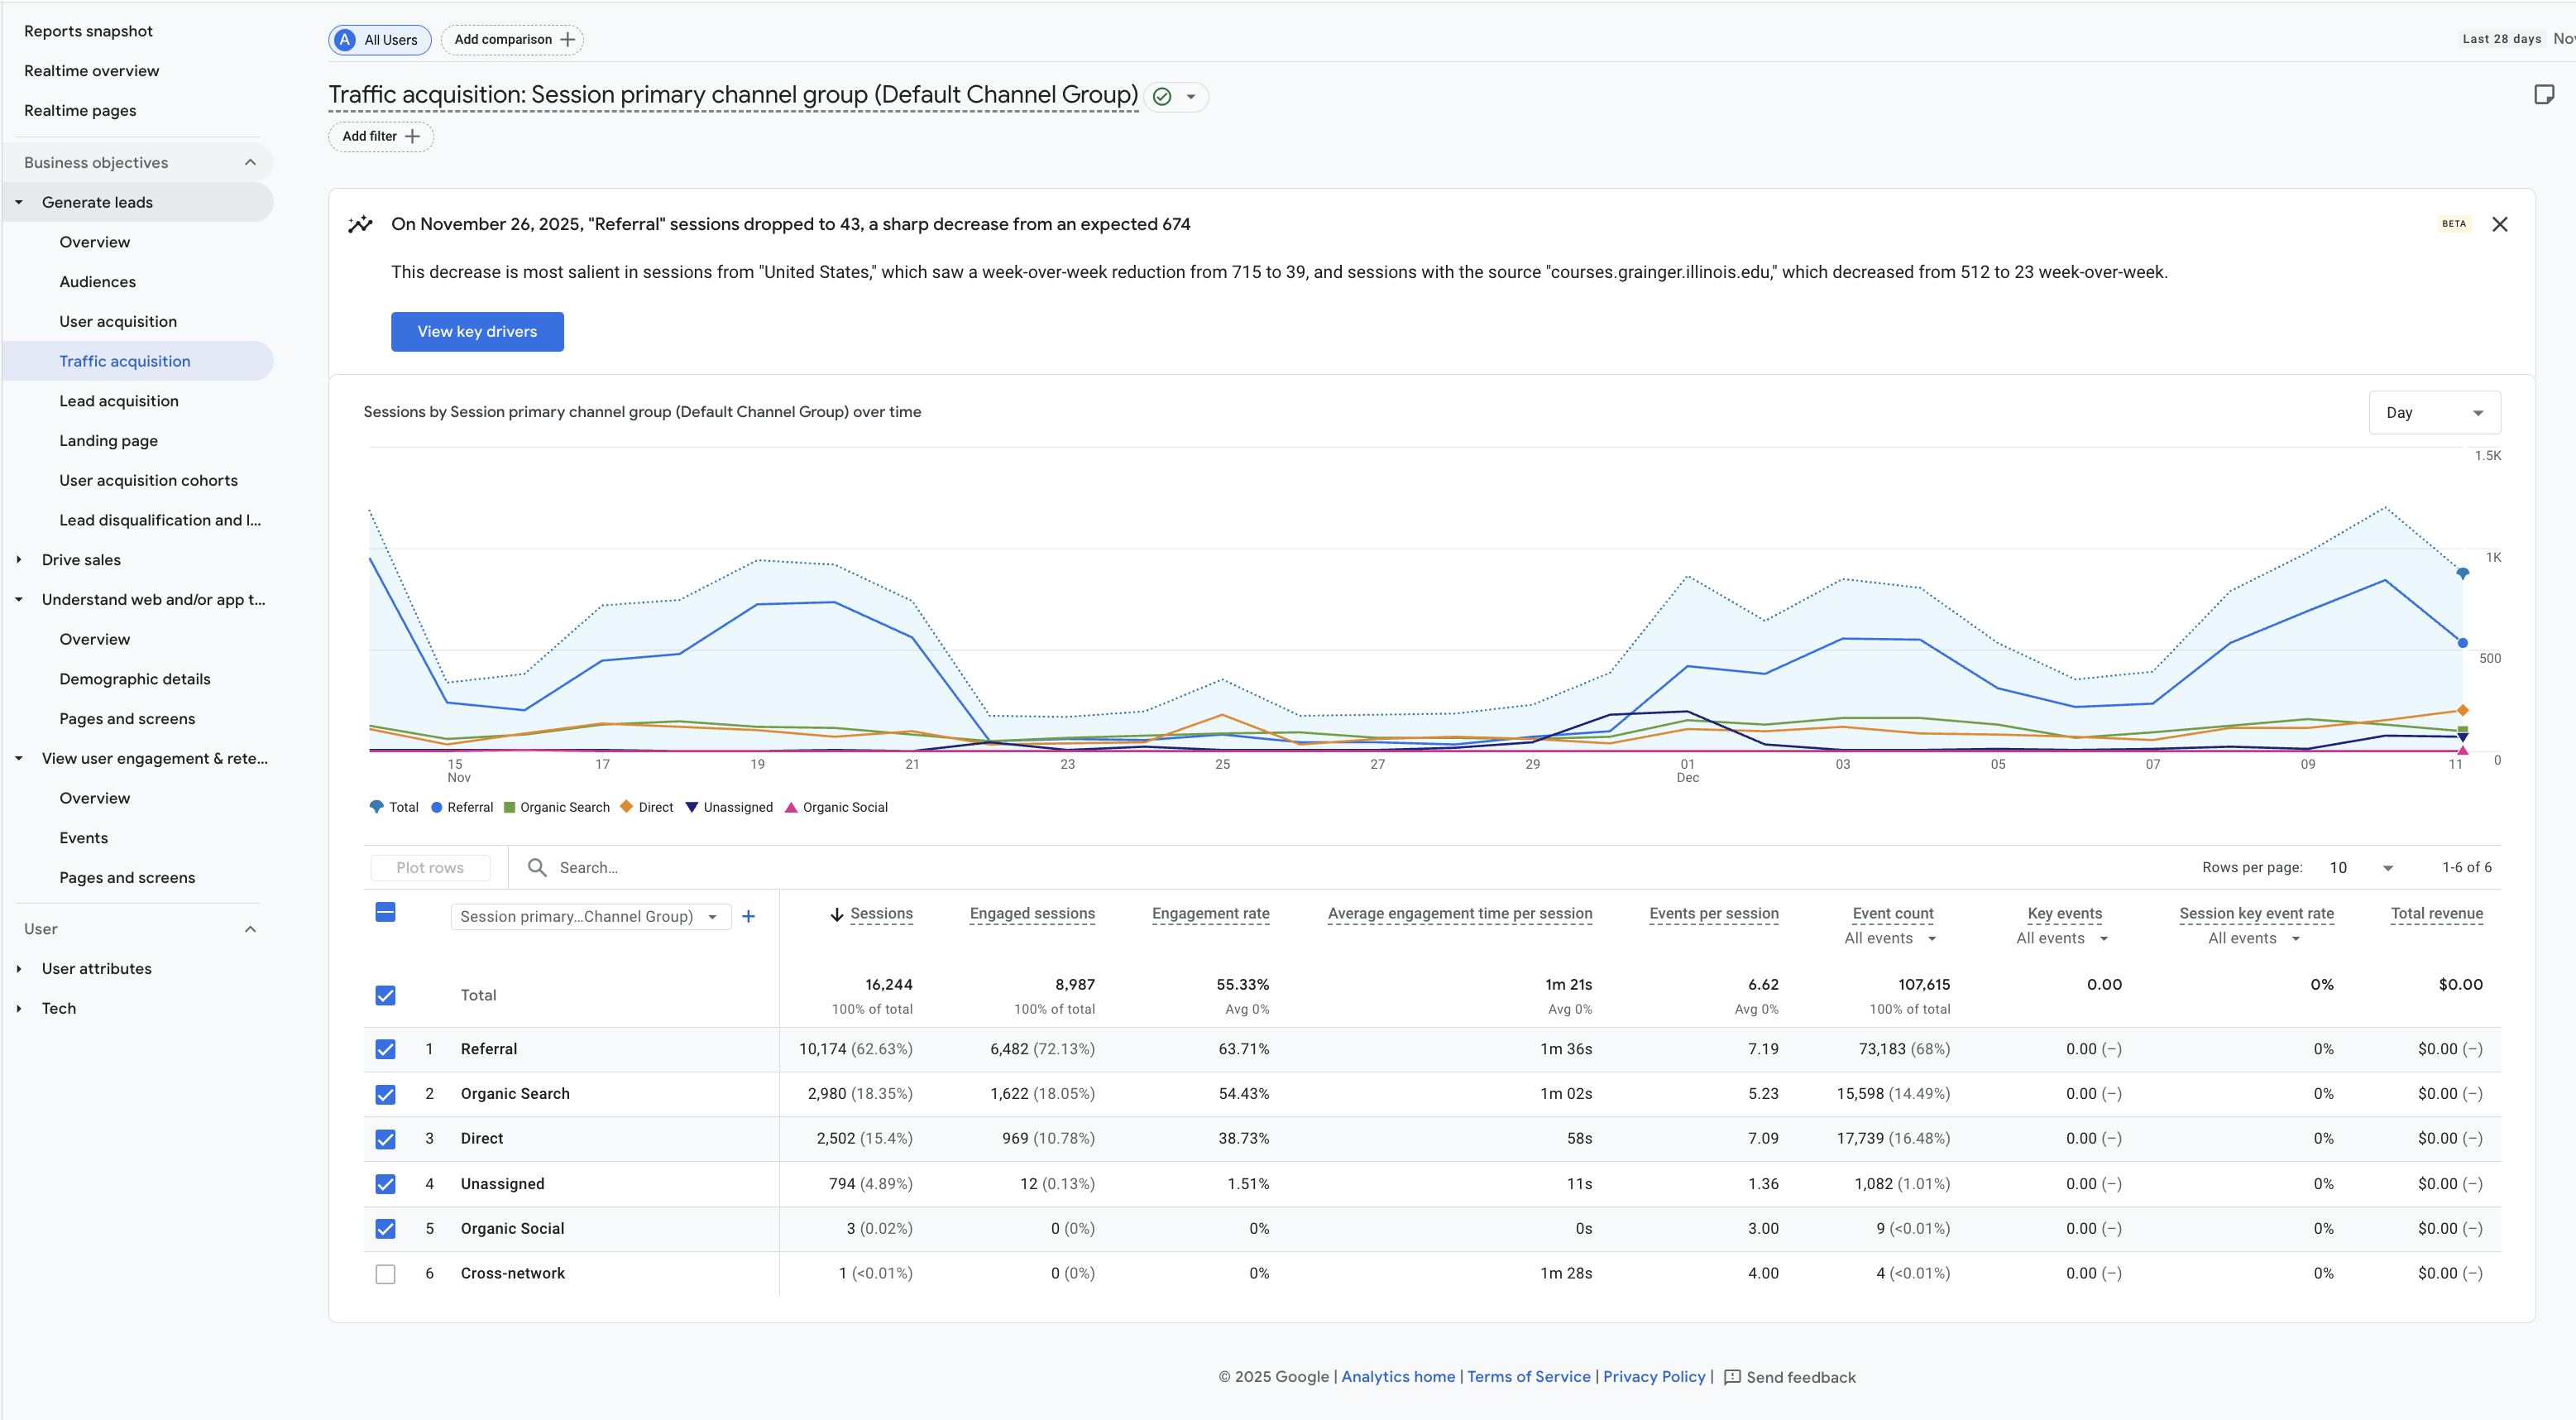
Traffic sources show how users arrive at your site, such as through search engines, direct links, or referrals from other platforms.
To view this data, navigate to Reports → Generate leads → Traffic acquisition or User acquisition. Use the default channel grouping to identify which sources (Organic Search, Direct, Referral, Social) drive the most users and engagement.
For page-specific analysis, add a comparison or filter to isolate traffic sources for a particular course page or exam-related content.
Interactions
Comparisons
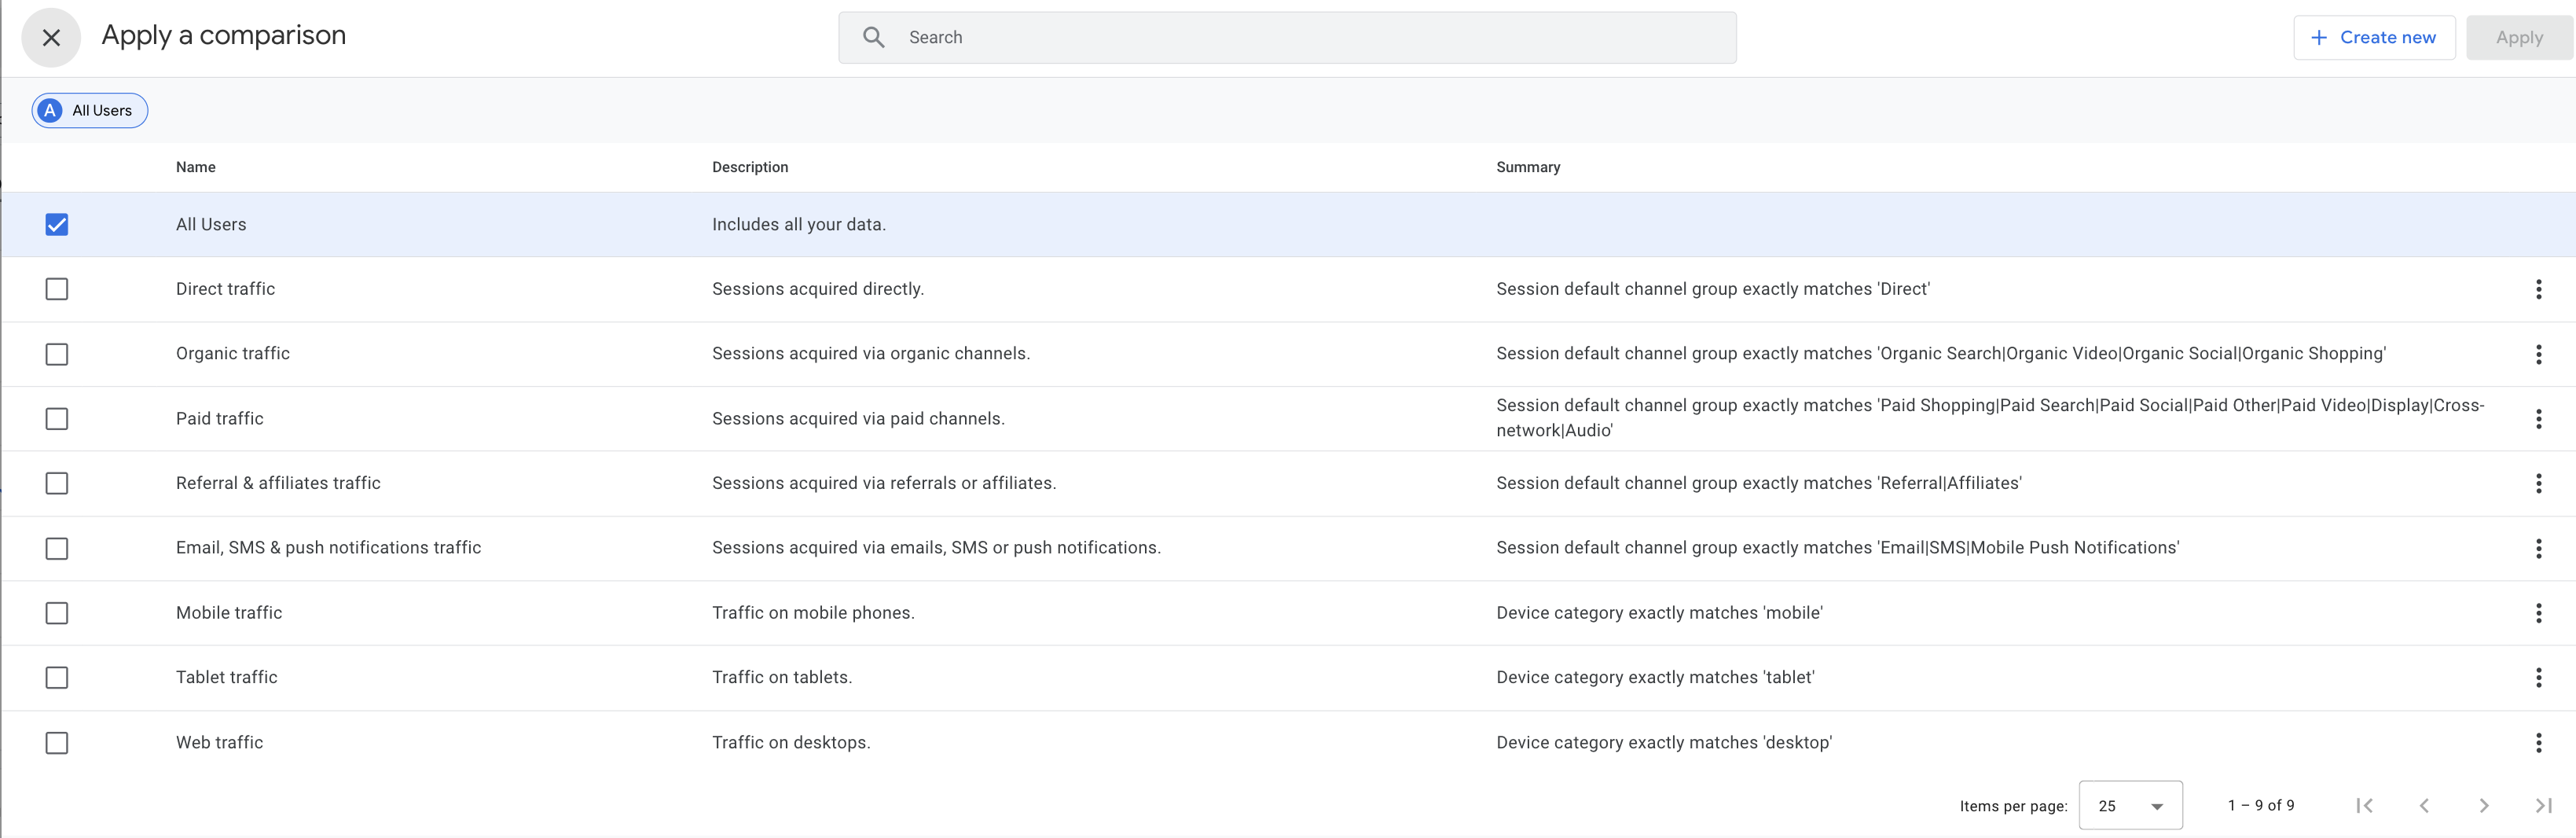
Clicking the Add comparison icon opens a side panel where you can select which metrics or segments to compare within the current report. This allows you to analyze differences between user groups, time periods, or traffic sources without leaving the page.
Comparisons are especially useful for evaluating changes in engagement before and after exams, contrasting desktop versus mobile usage, or identifying how different acquisition channels affect user behavior.
Interpreting Graphs
Hovering over any graph reveals detailed values at that point in time, such as exact user counts, engagement duration, or event totals.
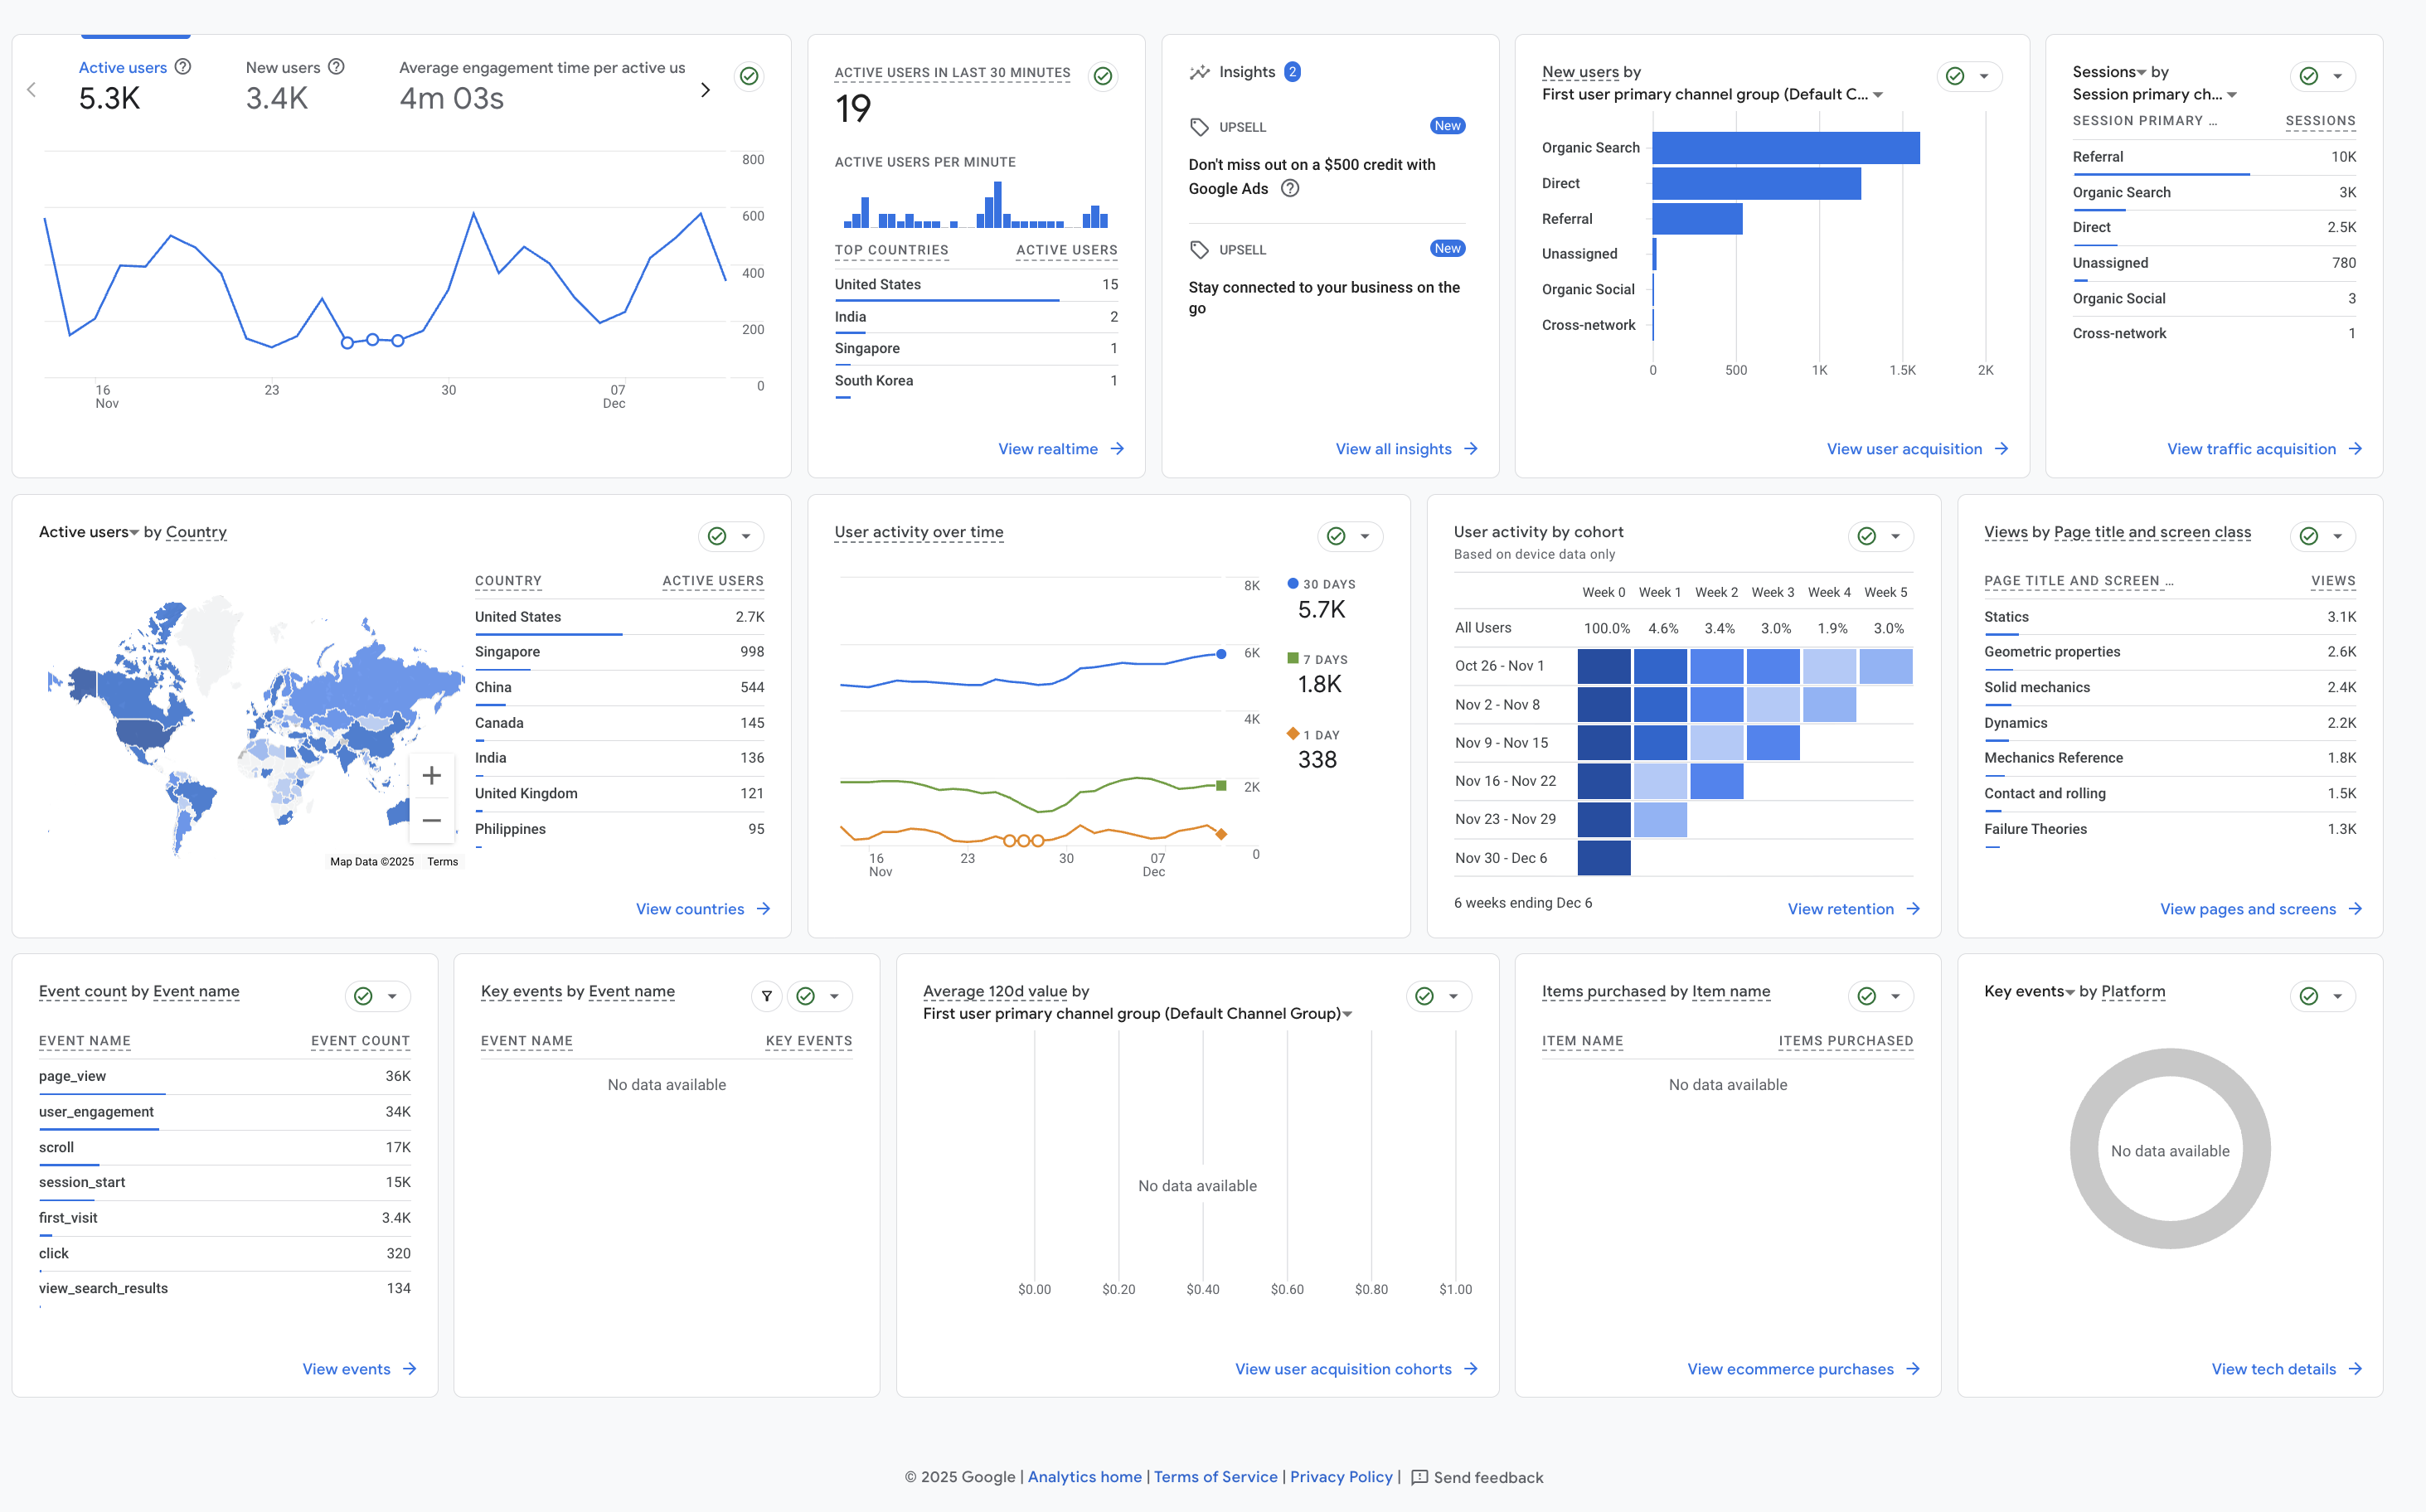
Insights: The Insights panel highlights automated observations generated by Google Analytics. These may include detected trends, anomalies, or recommendations based on recent user behavior.
New Users by Channel: This bar chart shows how new users first arrived at the site, grouped by acquisition channels such as Organic Search, Direct, and Referral. It helps identify which channels are most effective at bringing in first-time visitors.
Sessions by Channel: This table displays the total number of sessions grouped by traffic source. Unlike new users, this includes repeat visits and is useful for understanding sustained engagement from different acquisition channels.
Active Users by Country: The world map visualizes where users are geographically located. This can be used to identify international usage patterns or confirm whether traffic aligns with the expected student population.
User Activity Over Time: This time-series graph compares user activity across different time windows (30 days, 7 days, and 1 day). It helps distinguish long-term trends from short-term engagement spikes.
User Activity by Cohort: The cohort table groups users by their first visit date and shows how engagement changes over subsequent weeks. This visualization is useful for analyzing retention and whether users continue returning after initial exposure to the content.
Views by Page Title: This table lists the most-viewed pages on the site. It allows instructors to identify which topics or reference pages receive the most attention and which may need improvement.
Event Count by Event Name: This table breaks down how often tracked events occur, such as page views, scrolls, clicks, and session starts. Event counts provide insight into how users interact with the site beyond simply loading pages.
Key Events and Monetization Panels: These panels summarize key events, user value, and purchases if configured. For educational sites, these are often unused but remain available for advanced tracking or future feature expansion.
Exporting Data
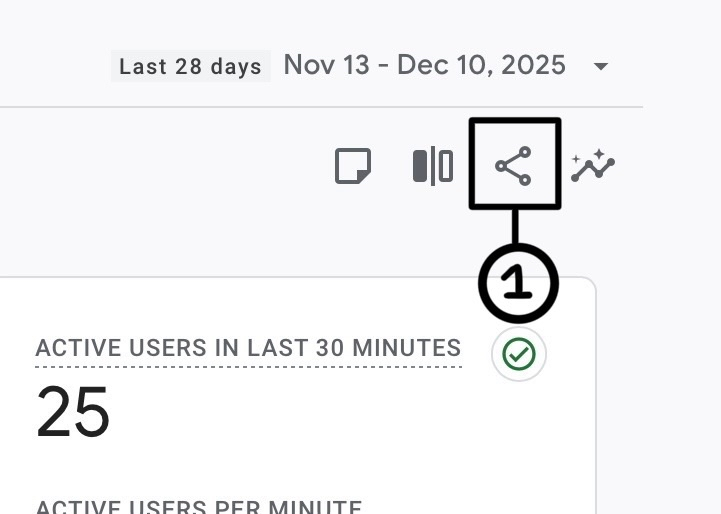
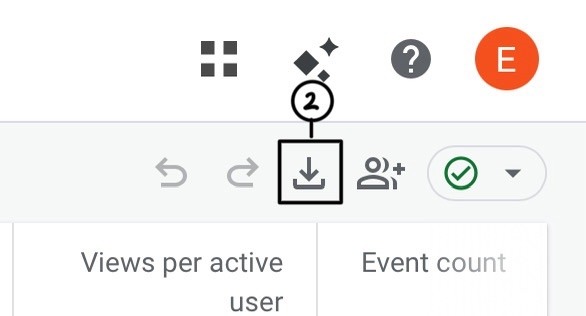
To export your data press the share/export button (1) and (2). This menu lets you download CSV files, export charts as PDFs, send data to Google Sheets, or create a shareable link.
You can also save chart screenshots for use in reports or presentations.
To automate exporting data, administrators can use the Schedule email option found under the Share this report menu. This allows reports to be automatically emailed on a set schedule (daily, weekly, monthly, or quarterly) as a PDF or CSV, including any filters, comparisons, and date ranges applied at the time of scheduling.
To customize a pre-made report, use the export option on the Reports page to send it to the Explore workspace, where you can modify dimensions, metrics, and visualizations.